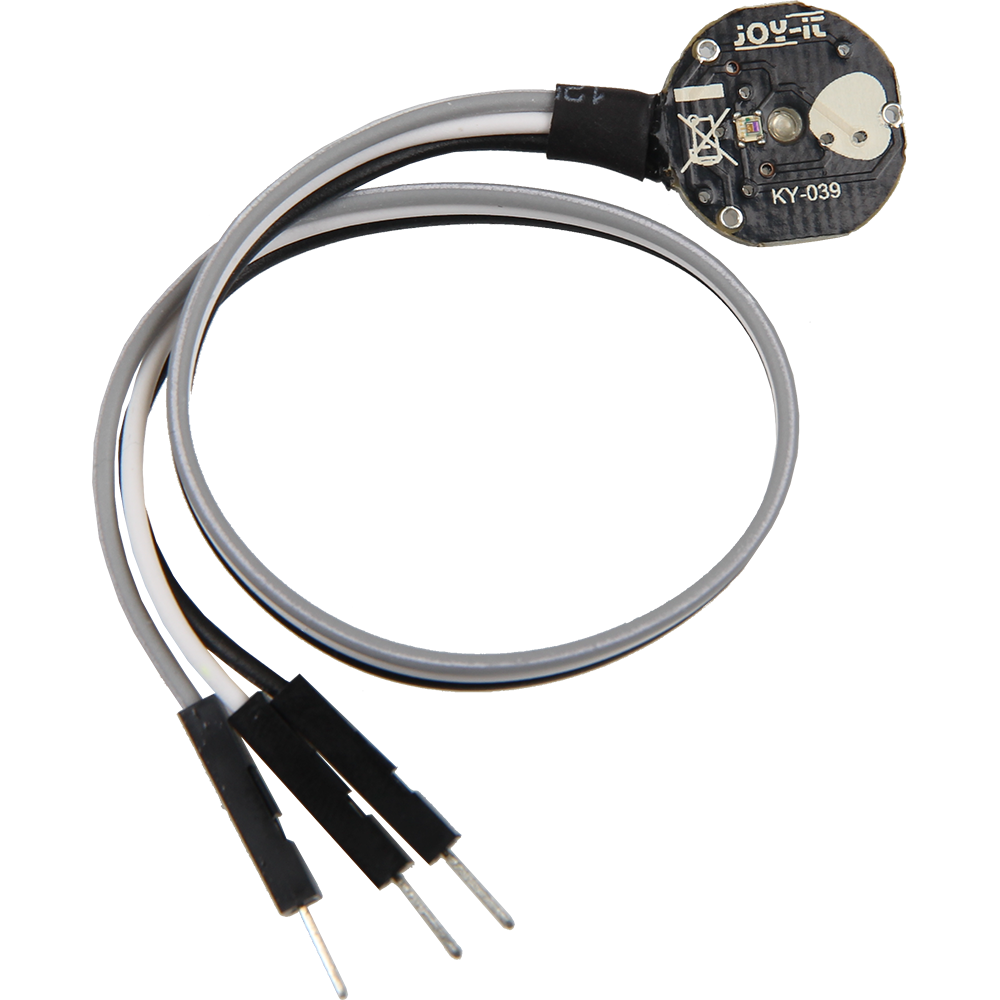
KY-039 Heartbeat sensor
If a finger is held between the infrared light-emitting diode and the photo transistor, the pulse can be detected at the signal output.
- Arduino
- Raspberry Pi
- Raspberry Pi Pico
- Micro:Bit
The heartbeat sensor detects the pulse when a finger is held between the infrared light-emitting diode and the phototransistor. The pulse can then be read at the signal output.
How a phototransistor works is as follows: A phototransistor works in a similar way to a normal transistor, with a higher current flowing through it the higher the control voltage applied to it. In a phototransistor, however, the incident light represents the control voltage. This means that the more light hits the phototransistor, the more current it lets through. In this sensor, the change in the amount of light caused by the blood flow in the finger is detected by the phototransistor and converted into a signal that can be used for pulse detection.
This sensor is ideal for projects where heart rate monitoring is required, such as in fitness trackers, health monitoring systems or other biometric applications.
If you connect a resistor in series in front of the transistor, the following behavior results when you measure the voltage across the transistor: If there is a lot of light shining on the transistor or if it is bright outside, you can measure a low voltage close to 0V - if the transistor is in the dark, it lets a relatively small current through and you measure a voltage close to +V.
The measurement setup with infrared diode and phototransistor built in this sensor module now allows us to measure the pulse by putting a finger between diode and transistor. Explanation: just as we know it from the flashlight, the skin on the hand can be shone through. If you hit a blood vessel, you can faintly see the blood pumping. This pumping can be recognized because the blood has a different density at different points in the vein and thus differences in brightness can be seen in the blood flow. Exactly these differences in brightness can be recorded with the sensor module and thus the pulse can be detected. This becomes clear when looking at the following oscilloscope image.
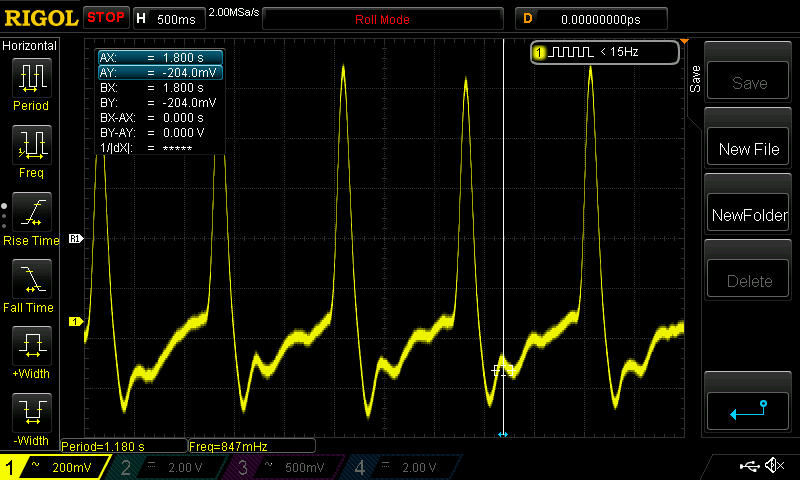
This shows on the Y-axis the change of the voltage at the phototransistor - thus the brightness changes caused by the flowing blood. The peaks marked above thus result in the beating of the heart. If you now calculate the registered beats per recorded time, you get a pulse of about 51 beats/minute (bpm).
As you can see on the upper oscilloscope picture, the recorded signal is relatively small and the transistor is very sensitive to pick up the weak signal. To get an optimal result, we recommend to prepare the module for measuring as shown in the following pictures:
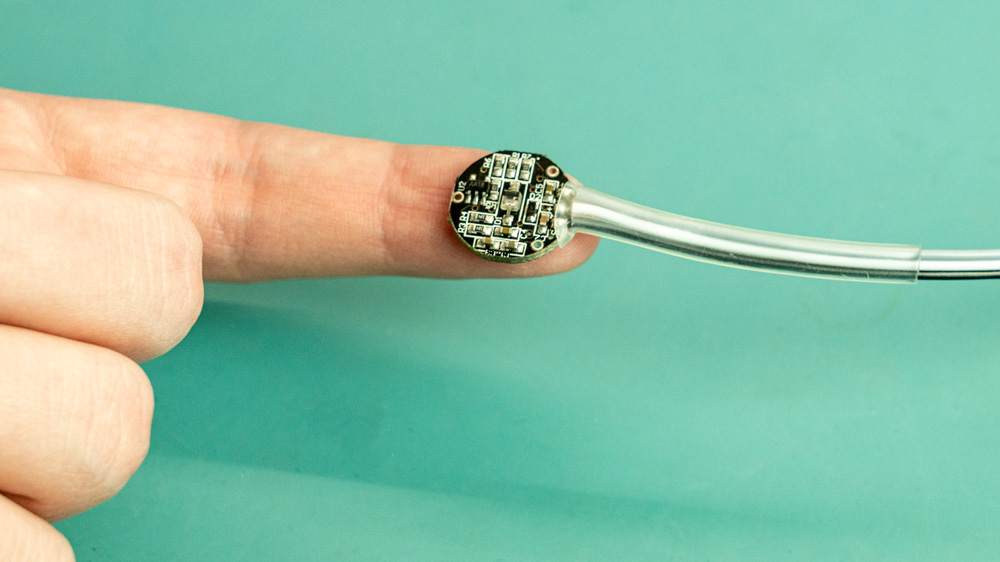
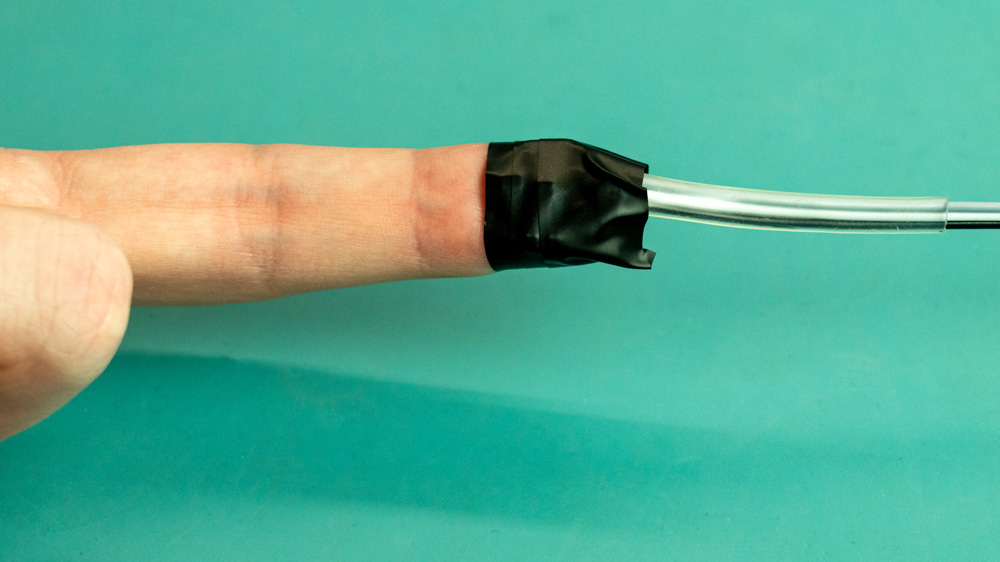
To increase the sensitivity of the sensor, we recommend fixing the sensor to the fingertip of the little finger using a plaster / adhesive tape / insulating tape.
The heartbeat is recorded/registered particularly well when the sensor is located over a larger blood vessel - to improve the signal, we also recommend changing the position of the sensor on the fingertip if necessary.
Pin assignment

| Cable color | Cable meaning |
|---|---|
| Black | Signal |
| White | + V |
| Gray | GND |

| Arduino | Sensor |
|---|---|
| Pin A0 | Signal |
| 5 V | + V |
| GND | GND |
Code example
To load the following code example onto your Arduino, we recommend using the Arduino IDE. In the IDE, you can select the appropriate port and board for your device.
Copy the code below into your IDE. To upload the code to your Arduino, simply click on the upload button.
////////////////////////////////////////////////////////////////////////
/// Copyright (c)2015 Dan Truong
/// Permission is granted to use this software under the MIT
/// licence, with my name and copyright kept in source code
/// http://http://opensource.org/licenses/MIT
///
/// KY039 Arduino Heartrate Monitor V1.0 (April 02, 2015)
////////////////////////////////////////////////////////////////////////

////////////////////////////////////////////////////////////////////////
/// @param [in] IRSensorPin Analog PI to which the sensor is connected
/// @param [in] delay (msec) The delay between calling up the sampling function.
//                           You get the best results when you scan 5 times per heartbeat.
///                          Not slower than 150mSec for e.g. 70 BPM pulse
///                          60 mSec would be better for e.g. up to a pulse of 200 BPM.
///
/// @ short description
/// This code represents a so-called peak detection.
/// No heartbeat history is recorded, but it
/// a search is made for "peaks" within the recorded data,
/// and indicated by LED. By means of the well-known delay intervals, you can
/// the pulse can be roughly calculated.
////////////////////////////////////////////////////////////////////////

int rawValue;

bool heartbeatDetected(int IRSensorPin, int delay) {
  static int maxValue = 0;
  static bool isPeak = false;
  bool result = false;
  rawValue = analogRead(IRSensorPin);
  // Here the current voltage value at the photo transistor is read out and stored temporarily in the rawValue variable
  rawValue *= (1000/delay);
  // Should the current value deviate too far from the last maximum value
  // (e.g. because the finger was put on again or taken away)
  // So the MaxValue is reset to get a new base.
  if (rawValue * 4L < maxValue) maxValue = rawValue * 0.8; // Detect new peak
  if (rawValue > maxValue - (1000/delay)) {
    // The actual peak is detected here. Should a new RawValue be bigger
    // as the last maximum value, it will be recognized as the top of the recorded data.
    if (rawValue > maxValue) {
      maxValue = rawValue;
    }
    // Only one heartbeat should be assigned to the recognized peak
    if (isPeak == false) {
      result = true;
    }
    isPeak = true;
  }
  else if (rawValue < maxValue - (3000/delay)) {
    isPeak = false;
    // This is the maximum value for each pass
    // slightly reduced again. The reason for this is that
    // not only the value is otherwise always stable with every stroke
    // would be the same or smaller, but also,
    // if the finger should move minimally and thus
    // the signal would generally become weaker.
    maxValue-=(1000/delay);
 }
  return result;
}
////////////////////////////////////////////////////////////////////////
// Arduino main code
////////////////////////////////////////////////////////////////////////
int ledPin=13;
int analogPin=0;

void setup() {
  // The built-in Arduino LED (Digital 13) is used here for output
  pinMode(ledPin,OUTPUT);
  // Serial output initialization
  Serial.begin(9600);
  Serial.println("KY-039 Heart rate measurement");
}
const int delayMsec = 60; // 100msec per sample
// The main program has two tasks:
// - If a heartbeat is recognized, the LED flashes briefly
// - The pulse is calculated and output on the serial output.

void loop() {
  static int beatMsec = 0;
  int heartRateBPM = 0;
  if (heartbeatDetected(analogPin, delayMsec)) {
    heartRateBPM = 60000 / beatMsec;
    /// LED output at heartbeat
    digitalWrite(ledPin,1);
    // Exclude values that are too high or too low
    if (heartRateBPM > 30 && heartRateBPM < 200){
      // Serial data output
      Serial.print("Pulse detected: ");
      Serial.println(heartRateBPM);
    }
    beatMsec = 0;
  }
  else {
    digitalWrite(ledPin,0);
  }
  delay(delayMsec);
  beatMsec += delayMsec;
}
The heartbeat sensor detects the pulse when a finger is held between the infrared light-emitting diode and the phototransistor. The pulse can then be read at the signal output.
How a phototransistor works is as follows: A phototransistor works in a similar way to a normal transistor, with a higher current flowing through it the higher the control voltage applied to it. In a phototransistor, however, the incident light represents the control voltage. This means that the more light hits the phototransistor, the more current it lets through. In this sensor, the change in the amount of light caused by the blood flow in the finger is detected by the phototransistor and converted into a signal that can be used for pulse detection.
This sensor is ideal for projects where heart rate monitoring is required, such as in fitness trackers, health monitoring systems or other biometric applications.
If you connect a resistor in series in front of the transistor, the following behavior results when you measure the voltage across the transistor: If there is a lot of light shining on the transistor or if it is bright outside, you can measure a low voltage close to 0V - if the transistor is in the dark, it lets a relatively small current through and you measure a voltage close to +V.
The measurement setup with infrared diode and phototransistor built in this sensor module now allows us to measure the pulse by putting a finger between diode and transistor. Explanation: just as we know it from the flashlight, the skin on the hand can be shone through. If you hit a blood vessel, you can faintly see the blood pumping. This pumping can be recognized because the blood has a different density at different points in the vein and thus differences in brightness can be seen in the blood flow. Exactly these differences in brightness can be recorded with the sensor module and thus the pulse can be detected. This becomes clear when looking at the following oscilloscope image.
This shows on the Y-axis the change of the voltage at the phototransistor - thus the brightness changes caused by the flowing blood. The peaks marked above thus result in the beating of the heart. If you now calculate the registered beats per recorded time, you get a pulse of about 71 beats/minute (bpm).
As you can see on the upper oscilloscope picture, the recorded signal is relatively small and the transistor is very sensitive to pick up the weak signal. To get an optimal result, we recommend to prepare the module for measuring as shown in the following pictures:
To increase the sensitivity of the sensor, we recommend fixing the sensor to the fingertip of the little finger using a plaster / adhesive tape / insulating tape.
The heartbeat is recorded/registered particularly well when the sensor is located over a larger blood vessel - to improve the signal, we also recommend changing the position of the sensor on the fingertip if necessary.
Pin assignment
| Cable color | Cable meaning |
|---|---|
| Black | Signal |
| Blue | + V |
| Gray | GND |

| Raspberry Pi | Sensor |
|---|---|
| 3,3 V [Pin 1] | +V |
| GND [Pin 6] | GND |
| - | Signal |
| Sensor | KY-053 |
|---|---|
| Signal | A0 |
| +V | - |
| GND | - |
| Raspberry Pi | KY-053 |
|---|---|
| GPIO 3 [Pin 5] | SCL |
| GPIO 2 [Pin 3] | SDA |
| 3,3 V [Pin 1] | VDD |
| GND [Pin 6] | GND |
Analog sensor, therefore the following must be considered: The Raspberry Pi has, in contrast to the Arduino, no analog inputs or there is no ADC (analog digital converter) integrated in the chip of the Raspberry Pi. This limits the Raspberry Pi, if you want to use sensors, which do not output digital values, but a continuously changing value (example: potentiometer -> different position = different voltage value).
To avoid this problem, our sensor kit X40 contains the KY-053, a module with a 16-bit ADC, which you can use on the Raspberry to expand it with 4 analog inputs. This module is connected to the Raspberry Pi via I2C, takes over the analog measurement and transfers the value digitally to the Raspberry Pi.
So we recommend to connect the KY-053 module with the mentioned ADC in between for analog sensors of this set. You can find more information on the KY-053 Analog Digital Converter information page.
Code example
The program uses the corresponding ADS1x15 and I2C Python libraries from Adafruit to control the ADS1115 ADC. These have been published at the following link https://github.com/adafruit/Adafruit_CircuitPython_ADS1x15 under the MIT license. The required libraries are not included in the download package below.
With the help of the ADS1115 ADC, the program measures the current voltage value at the ADC, calculates the current resistance of the NTC from this, calculates the temperature with the help of values determined in advance for this sensor and outputs them to the console.
Please note that you must enable I2C on your Raspberry Pi before using this example.
import time
import board
import busio
import adafruit_ads1x15.ads1115 as ADS
from adafruit_ads1x15.analog_in import AnalogIn

# Create the I2C bus
i2c = busio.I2C (board.SCL, board.SDA)

# Create the ADC object using the I2C bus
ads = ADS.ADS1115 (i2c)

# Create single-ended input on channels
chan0 = AnalogIn (ads, ADS.P0)
chan1 = AnalogIn (ads, ADS.P1)
chan2 = AnalogIn (ads, ADS.P2)
chan3 = AnalogIn (ads, ADS.P3)

if __name__ == '__main__':


    # initialization
    GAIN = 2/3
    curState = 0
    thresh = 525 # mid point in the waveform
    P = 512
    T = 512
    stateChanged = 0
    sampleCounter = 0
    lastBeatTime = 0
    firstBeat = True
    secondBeat = False
    Pulse = False
    IBI = 600
    rate = [0] * 10
    amp = 100

    lastTime = int (time.time () * 1000)

    # Main loop. use Ctrl-c to stop the code
    while True:
        # read from the ADC
        Signal = chan0.value #TODO: Select the correct ADC channel. I have selected A0 here
        curTime = int (time.time () * 1000)

        sampleCounter + = curTime - lastTime; ## keep track of the time in mS with this variable
        lastTime = curTime
        N = sampleCounter - lastBeatTime; # # monitor the time since the last beat to avoid noise


        ## find the peak
        if Signal <thresh and N> (IBI / 5.0) * 3.0: # # avoid dichrotic noise by waiting 3/5 of last IBI
            if Signal <T: # T is the through
              T = signal; # keep track of lowest point in pulse wave

        if Signal> thresh and Signal> P: # thresh condition helps avoid noise
            P = signal; # P is the peak
                                                # keep track of highest point in pulse wave


          # signal surges up in value every time there is a pulse
        if N> 250: # avoid high frequency noise
            if (Signal> thresh) and (Pulse == False) and (N> (IBI / 5.0) * 3.0):
              Pulse = true; # set the pulse flag when we think there is a pulse
              IBI = sampleCounter - lastBeatTime; # measure time between beats in mS
              lastBeatTime = sampleCounter; # keep track of time for next pulse

              if secondBeat: # if this is the second beat, if secondBeat == TRUE
                secondBeat = False; # clear secondBeat flag
                for i in range (0,10): # seed the running total to get a realistic BPM at startup
                  rate [i] = IBI;

              if firstBeat:
                firstBeat = False;
                secondBeat = True;
                continue


              # keep a running total of the last 10 IBI values
              runningTotal = 0; # clear the runningTotal variable

              for i in range (0.9): # shift data in the rate array
                rate [i] = rate [i + 1];
                runningTotal + = rate [i];

              rate [9] = IBI;
              runningTotal + = rate [9];
              runningTotal / = 10;
              BPM = 60000 / runningTotal;
              print ('BPM: {}'. format (BPM))

        if Signal> thresh and Pulse == True: # when the values are going down, the beat is over
            Pulse = false;
            amp = P-T;
            thresh = amp / 2 + T;
            P = thresh;
            T = thresh;

        if N> 2500: # if 2.5 seconds go by without a beat
            thresh = 512; # set thresh default
            P = 512; # set P default
            T = 512; # set T default
            lastBeatTime = sampleCounter; # bring the lastBeatTime up to date
            firstBeat = True; # set these to avoid noise
            secondBeat = False; # when we get the heartbeat back
            print ("no beats found")

        time.sleep (0.005)
Sample program download
Start with the command:
sudo python3 KY039.py
The heartbeat sensor detects the pulse when a finger is held between the infrared light-emitting diode and the phototransistor. The pulse can then be read at the signal output.
How a phototransistor works is as follows: A phototransistor works in a similar way to a normal transistor, with a higher current flowing through it the higher the control voltage applied to it. In a phototransistor, however, the incident light represents the control voltage. This means that the more light hits the phototransistor, the more current it lets through. In this sensor, the change in the amount of light caused by the blood flow in the finger is detected by the phototransistor and converted into a signal that can be used for pulse detection.
This sensor is ideal for projects where heart rate monitoring is required, such as in fitness trackers, health monitoring systems or other biometric applications.
If you connect a resistor in series in front of the transistor, the following behavior results when you measure the voltage across the transistor: If there is a lot of light shining on the transistor or if it is bright outside, you can measure a low voltage close to 0V - if the transistor is in the dark, it lets a relatively small current through and you measure a voltage close to +V.
The measurement setup with infrared diode and phototransistor built in this sensor module now allows us to measure the pulse by putting a finger between diode and transistor. Explanation: just as we know it from the flashlight, the skin on the hand can be shone through. If you hit a blood vessel, you can faintly see the blood pumping. This pumping can be recognized because the blood has a different density at different points in the vein and thus differences in brightness can be seen in the blood flow. Exactly these differences in brightness can be recorded with the sensor module and thus the pulse can be detected. This becomes clear when looking at the following oscilloscope image.
This shows on the Y-axis the change of the voltage at the phototransistor - thus the brightness changes caused by the flowing blood. The peaks marked above thus result in the beating of the heart. If you now calculate the registered beats per recorded time, you get a pulse of about 71 beats/minute (bpm).
As you can see on the upper oscilloscope picture, the recorded signal is relatively small and the transistor is very sensitive to pick up the weak signal. To get an optimal result, we recommend to prepare the module for measuring as shown in the following pictures:
To increase the sensitivity of the sensor, we recommend fixing the sensor to the fingertip of the little finger using a plaster / adhesive tape / insulating tape.
The heartbeat is recorded/registered particularly well when the sensor is located over a larger blood vessel - to improve the signal, we also recommend changing the position of the sensor on the fingertip if necessary.
Pin assignment
| Cable color | Cable meaning |
|---|---|
| Black | Signal |
| Blue | + V |
| Gray | GND |

| Micro: bit | Sensor |
|---|---|
| 3 V | + V |
| GND | GND |
| Pin 2 | Signal |
Code example
		let hrNo = 0
		let d = 0
		let c = 0
		let b = 0
		let a = 0
		let bpm = 0
		basic.showIcon(IconNames.Heart)
		serial.setBaudRate(BaudRate.BaudRate115200)
		pins.analogSetPeriod(AnalogPin.P2, 20000)
		let timer = 0
		let peakCount = 0
		basic.forever(function () {
		    for (let index = 0; index < 5; index++) {
		        timer += 1
		        basic.pause(1000)
		    }
		    bpm = peakCount / 5 * 6
		    timer = 0
		    peakCount = 0
		    serial.writeLine("BPM is " + Math.round(bpm))
		    basic.pause(1000)
		})
		basic.forever(function () {
		    a = pins.analogReadPin(AnalogPin.P2)
		    basic.pause(20)
		    b = pins.analogReadPin(AnalogPin.P2)
		    basic.pause(20)
		    c = pins.analogReadPin(AnalogPin.P2)
		    basic.pause(20)
		    d = pins.analogReadPin(AnalogPin.P2)
		    basic.pause(20)
		    hrNo = (a + b + c + d) / 4
		    serial.writeNumber(hrNo)
		    if (hrNo > 520) {
		        peakCount += 1
		    }
		    serial.writeLine("")
		})
Sample program download
The heartbeat sensor detects the pulse when a finger is held between the infrared light-emitting diode and the phototransistor. The pulse can then be read at the signal output.
How a phototransistor works is as follows: A phototransistor works in a similar way to a normal transistor, with a higher current flowing through it the higher the control voltage applied to it. In a phototransistor, however, the incident light represents the control voltage. This means that the more light hits the phototransistor, the more current it lets through. In this sensor, the change in the amount of light caused by the blood flow in the finger is detected by the phototransistor and converted into a signal that can be used for pulse detection.
This sensor is ideal for projects where heart rate monitoring is required, such as in fitness trackers, health monitoring systems or other biometric applications.
If you connect a resistor in series in front of the transistor, the following behavior results when you measure the voltage across the transistor: If there is a lot of light shining on the transistor or if it is bright outside, you can measure a low voltage close to 0V - if the transistor is in the dark, it lets a relatively small current through and you measure a voltage close to +V.
The measurement setup with infrared diode and phototransistor built in this sensor module now allows us to measure the pulse by putting a finger between diode and transistor. Explanation: just as we know it from the flashlight, the skin on the hand can be shone through. If you hit a blood vessel, you can faintly see the blood pumping. This pumping can be recognized because the blood has a different density at different points in the vein and thus differences in brightness can be seen in the blood flow. Exactly these differences in brightness can be recorded with the sensor module and thus the pulse can be detected. This becomes clear when looking at the following oscilloscope image.
This shows on the Y-axis the change of the voltage at the phototransistor - thus the brightness changes caused by the flowing blood. The peaks marked above thus result in the beating of the heart. If you now calculate the registered beats per recorded time, you get a pulse of about 71 beats/minute (bpm).
As you can see on the upper oscilloscope picture, the recorded signal is relatively small and the transistor is very sensitive to pick up the weak signal. To get an optimal result, we recommend to prepare the module for measuring as shown in the following pictures:
To increase the sensitivity of the sensor, we recommend fixing the sensor to the fingertip of the little finger using a plaster / adhesive tape / insulating tape.
The heartbeat is recorded/registered particularly well when the sensor is located over a larger blood vessel - to improve the signal, we also recommend changing the position of the sensor on the fingertip if necessary.
Pin assignment
| Cable color | Cable meaning |
|---|---|
| Black | Signal |
| White | + V |
| Gray | GND |

| Raspberry Pi Pico | Sensor |
|---|---|
| 3,3 V | +V |
| GND | GND |
| GPIO26 (A0) | Signal |
You can also use an ADC such as the KY-053. This ADC has a higher resolution than the internal ADC of the Raspberry Pi Pico, which means that the sensor can be analysed more accurately.
Code example
To load the following code example onto your Pico, we recommend using the Thonny IDE. All you have to do first is go to Run > Configure interpreter ... > Interpreter > Which kind of interpreter should Thonny use for running your code? and select MicroPython (Raspberry Pi Pico).
Now copy the code below into your IDE and click on Run.
# Import the libraries
from machine import ADC
import utime

# Use GPIO26 as analog input
analog_pin = ADC(0)

# Initialization variables
raw_value = 0
max_value = 0
is_peak = False

# Function for detecting a heartbeat
def heartbeat_detected(ir_sensor_pin, delay_msec):
    global raw_value, max_value, is_peak

    result = False
    # Read the current voltage value (0 to 65535)
    raw_value = ir_sensor_pin.read_u16()
    # Adjust the value to the delay
    raw_value = (raw_value * 1000) // delay_msec

    # Reset the maximum value if the difference is too large
    if raw_value * 4 < max_value:
        max_value = int(raw_value * 0.8)

    # Peak detection
    if raw_value > max_value - (1000 // delay_msec):
        if raw_value > max_value:
            max_value = raw_value
        # Only one heartbeat should be assigned to the detected peak
        if not is_peak:
            result = True
        is_peak = True
    elif raw_value < max_value - (3000 // delay_msec):
        is_peak = False
        # Here, the maximum value is lowered slightly with each run
        # is slightly reduced again. The reason for this is that
        # not only would the value otherwise always be stable with each stroke
        # would become the same or smaller, but also
        # if the finger should move minimally and thus
        # the signal would generally become weaker.
        max_value -= 1000 // delay_msec

    return result

# Delay in milliseconds per scan
delay_msec = 60
beat_msec = 0

print("KY-039 Heart rate measurement")

while True:
    heart_rate_bpm = 0
    if heartbeat_detected(analog_pin, delay_msec):
        # Only calculate heartbeat if beat_msec is not 0
        if beat_msec > 0:
            heart_rate_bpm = 60000 // beat_msec
        # Only output the pulse if it is within the realistic range
        if 30 < heart_rate_bpm < 200:
            print("Pulse detected: {} BPM".format(heart_rate_bpm))
        # Reset after detection
        beat_msec = 0

    utime.sleep_ms(delay_msec)
    beat_msec += delay_msec